So, a while ago I setup a Raspberry Pi with a 3" LCD displaying some nice pretty graphs about my home network connectivity. I did a small video of it running, which got a couple requests for instruction on how I did it.
In this post I'm going to explain how I setup a network monitor using a Raspberry Pi with a 3.2" LCD display. I use Zabbix for monitoring the network and generating the graphs which we'll display on the LCD display.
As a prerequisite, you'll need a Raspberry Pi with Raspbian installed and a working LCD display connected to the GPIO. You'll also need to be starting up in the console, and not XWindows because we'll be using the frame buffer to display our graphs.
Installing Zabbix
I cover this topic in a step by step guide to installing Zabbix 3 on a Raspberry Pi I wrote. Just follow the guide, and you'll hopefully be good to go.
Creating Zabbix Graphs
There's a lot of information on the Internet on how to setup Zabbix to monitor just about anything. In this instance we'll monitor our internet download speed by downloading a 5MB file every 60 seconds and record the speed of the download.
Login to your Zabbix web UI as an administrator and click on Configuration, then Hosts. Here you'll see a list of all the hosts you're monitoring. At the very least you should have a "Zabbix server" there.
Quick note: We need to ensure the Zabbix server is enabled. If under the status column your Zabbix server has "Disabled", click on the "Disabled" link, which should do the trick.
Next we need to get our Zabbix server to download a 5mb file every 60 seconds.
- Click on the "Web" link in the "WEB" column of or Zabbix server.
- Complete the "Scenario" form. Enter something like "Download 5MB File" for a name and enter "Network" as a new application.

- Click on the "Steps" tab, then click "Add".
- This is where we'll download the 5MB file. Thinkbroadband.com have a number of different files for exactly this purpose. In this case we can opt for the 5MB file on port 80.
Note: Your ISP may supply test files on their own network which may better more accurate readings.
Enter "200" as the required status code, and up the Timeout to 50 seconds. Click "Update" when done.
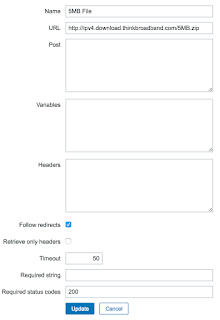
- Click the "Save" button.


At this point we should be downloading the 5MB file every 60 seconds and recording the speed in bits per second (bps). Now we need to create a graph to display on the Pi.
- Let's go back to our hosts (click on Configuration, then Hosts).
- Click on the "Graphs" link for your Zabbix server.
- Click on the "Create graph" button.
- Enter a descriptive name such as "Download Speed (Pi)".
- Because we're displaying our graph on a small, low resolution display, we need to limit the size of our graph. I've found setting the graph width to 200, the height to 110 and unticking "Show legend", "Show working time" and "Show triggers".
- Click "Add" under items.
- Select "Zabbix servers" from the Group dropdown.
- "Zabbix server" from the Host.
- Check the 'Download speed for scenario "Download 5MB File"' Web monitoring item we created earlier.
- Scroll down and click "Select".
- You should now have a configured graph. Click the "Preview" tab to see what it will look like. Click "Add" to save the graph.
- When you're back in the Graphs screen for the Zabbix server, roll your mouse pointer over the "Download Speed (Pi)" graph we just created and take note of the URL. You'll notice something like "graphid=522". Take note of that graphid number, because we're going to need it to display the graph on the LCD.


Displaying the graph on the Raspberry Pi.
Note: We're going to use the frame buffer to display our graph on the LCD screen, so you'll need to make sure your Pi boots up into the console on the LCD display, and not XWindows.
Setting up the Pygame application
I wrote an application using Pygame to display our graph images (or any image) on our LCD display.
- Login to your Raspberry Pi console, or SSH in.
- Either clone or download the application from GitHub. In this example we'll just download it.
wget https://github.com/rgifford/Raspberry-Pi-LCD-Web-Slideshow/archive/master.zip
unzip master.zip
cd Raspberry-Pi-LCD-Web-Slideshow-master - Now we need to edit slideshow.json, and point it to our graphs. Now, I know JSON is not exactly made for configurations - but hey, it works.
{
    "repeat": 2,
    "slides": [
    {
        "url": "http://localhost/zabbix/index.php?name=<your-zabbix-user>&password=<your-zabbix-password>&enter=Sign%20in&request=chart2.php?graphid=<your-graphid>&period=3600&width=200&height=120",
        "transition": "fade",
        "delay": 5,
        "background_colour": "255,255,255"
    }
    ]
}
In this JSON file, there are a few things to not: - The repeat value can be any integer. It's just how many times we'll loop over the slides. If you enter 0, then it repeats on indefinitely.
- In this example, we only have one image showing... but you could put as many entries under 'slides' as you want.
- Each slide entry needs a URL to the image that will be displayed.
- Each slide entry needs a delay - this is how many seconds the slide will be displayed for.
- Each slide entry needs a transition. This is the transition style which the slide use to transition from the previous slide. Currently only 'fade' is supported.
- With the URL, you need to make sure you update a few things.
- Replace the <your-zabbix-password> with your zabbix username you want to use to login with to get the graph.
- Replace the <your-zabbix-password> with your zabbix password.
- Replace the <your-graphid> with the graphid of the graph you wish to display.
- You can set the period value to anything you want to. It's the time period you're showin in seconds.
- You can play around with the height and width settings to see if you can get the graphs looking better on the small screen.
- You can also specify stime, which is the start timestamp if you want to show older data.
- Once you've edited the json file, let's run the slideshow.
sudo python slideshow.py
All things going well, you should see a graph pop up on your Pi LCD.